|
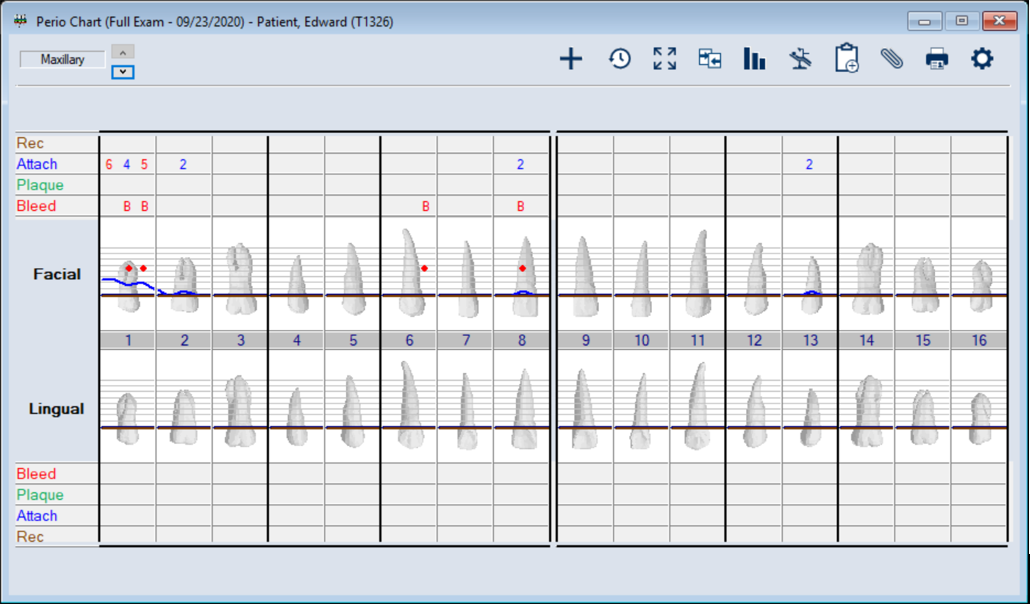
The values and condition symbols from a patient’s most recent perio exam display on the odontogram in the Perio Chart window.
Note: A patient’s most recent perio exam is their latest exam, regardless of whether it is incomplete, complete, or closed.
Depending on how conditions are configured for your institution during setup, the color may be customized, the values may display as numeric, alphanumeric, or as yes/no, and the symbols may include lines, bars, text, or dots.
Example: In the case below, a bleeding condition has been identified on the sites 1, 2, 6 and 8. Each is marked with a B and a red dot on the odontogram.
If you want to monitor changes between multiple exams, you can also compare individual conditions across multiple exams.
 View the Current Perio Chart View the Current Perio Chart
- Select a patient and open the Perio Chart module.
- From the Perio Chart window, review the odontogram as necessary.
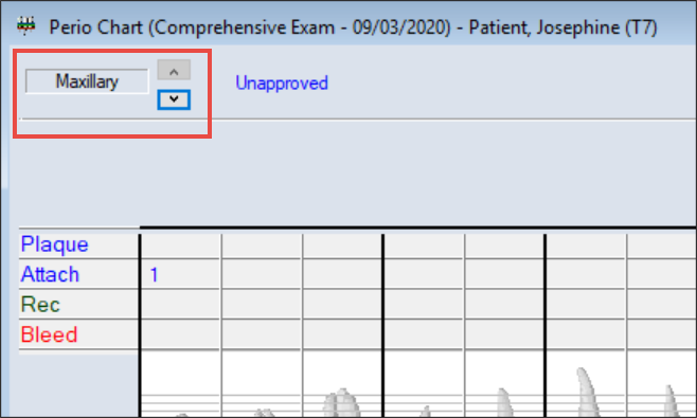
- To display upper or lower teeth, complete any of the following:
- Click the Up (
 ) button to display the Maxillary option and display the upper teeth in the chart. ) button to display the Maxillary option and display the upper teeth in the chart.
- Click the Down (
 ) button to display the Mandibular option and display the lower teeth in the chart. ) button to display the Mandibular option and display the lower teeth in the chart.
- (Optional) To view the patient’s perio chart in full-mouth view and see all teeth in the same window, complete the following:
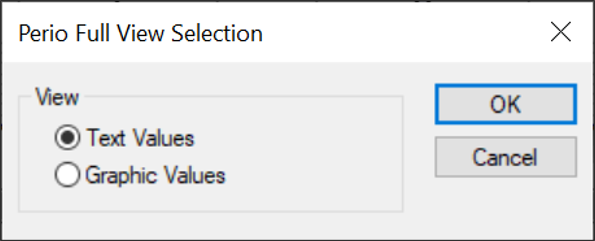
- Click the Full View (
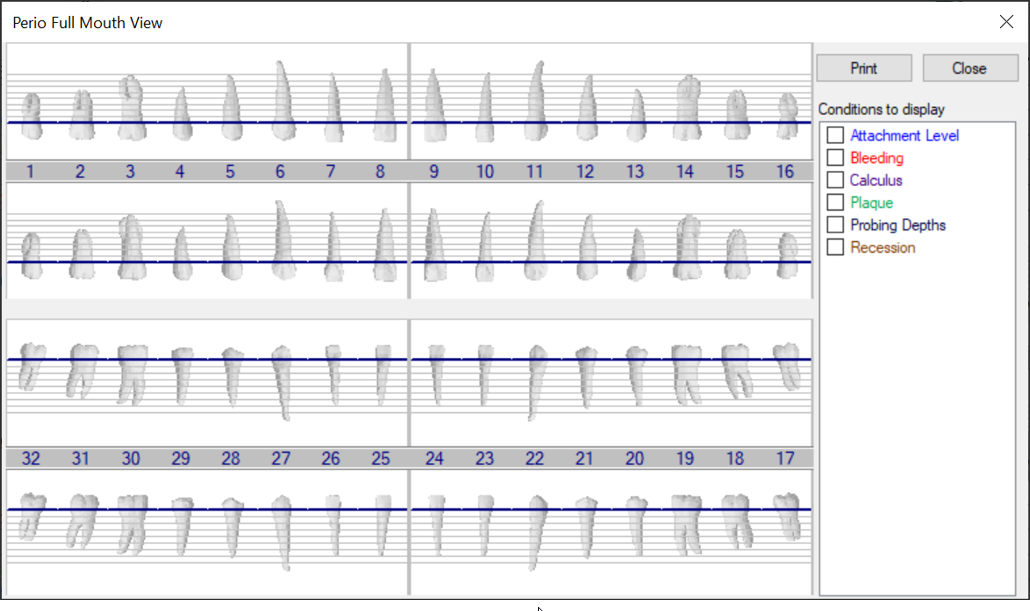
 ) icon to display the Perio Full View Selection window. ) icon to display the Perio Full View Selection window. Note: The Perio Full View Selection window only displays if the Perio Options window > Full Mouth View field is set to Selectable. If set to Text or Graphic, the applicable window opens automatically. - Select a radio button and click OK.
- If in graphic view, under Conditions to display, select and deselect each checkbox as necessary.
- (Optional) Print the full-mouth view.
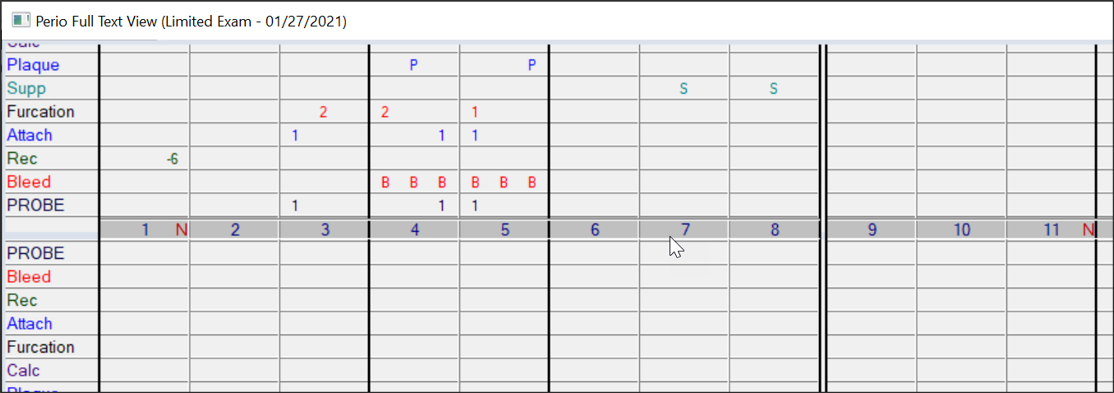
- If viewing the Perio Full Text View window, right-click and select Print.
- If viewing the Perio Full Mouth View window, click Print.
Compare Conditions across Exams
When there are multiple exams on a patient record, you can compare them by individual condition to gauge changes in a patient's perio health and monitor patient progress.
Note: You can compare up to five exams at a time.
When necessary, you can also print the perio record comparisons.
To compare conditions across exams:
- Select a patient and open the Perio Chart module.
- Click the Compare Form (
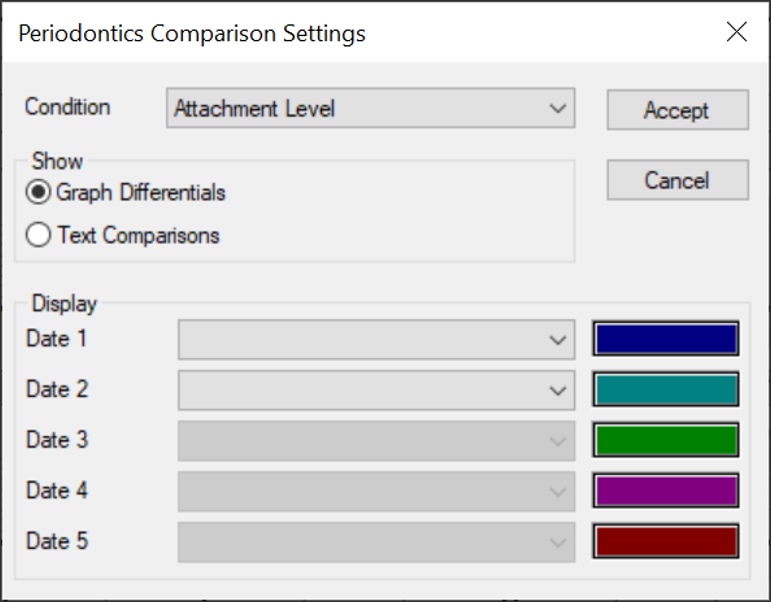
 ) icon to display the Periodontics Comparison Settings window. ) icon to display the Periodontics Comparison Settings window.
-
From the Condition drop-down list, select the condition you want to compare.
-
Under Show, select a radio button:
-
Graph Differentials: Shows the comparison in graph form. Opens the Perio Full Mouth View window to display the patient’s chart graphically and allows you to choose which conditions to include.
-
Text Comparisons: Shows the comparison in text form. Opens the Perio Full Text View window and displays the patient’s chart details using only text values.
-
To select an exam, complete the following:
-
From a Date [x] drop-down list, select an exam date.
-
Next to the drop-down list, click the color bar and select a color.
-
Repeat Step 5 as necessary for each exam date you want to include.
Note: If the Graph Differentials radio button is selected, you can only select two exam dates.
-
Click Accept to display the Periodontics – Comparison View window.
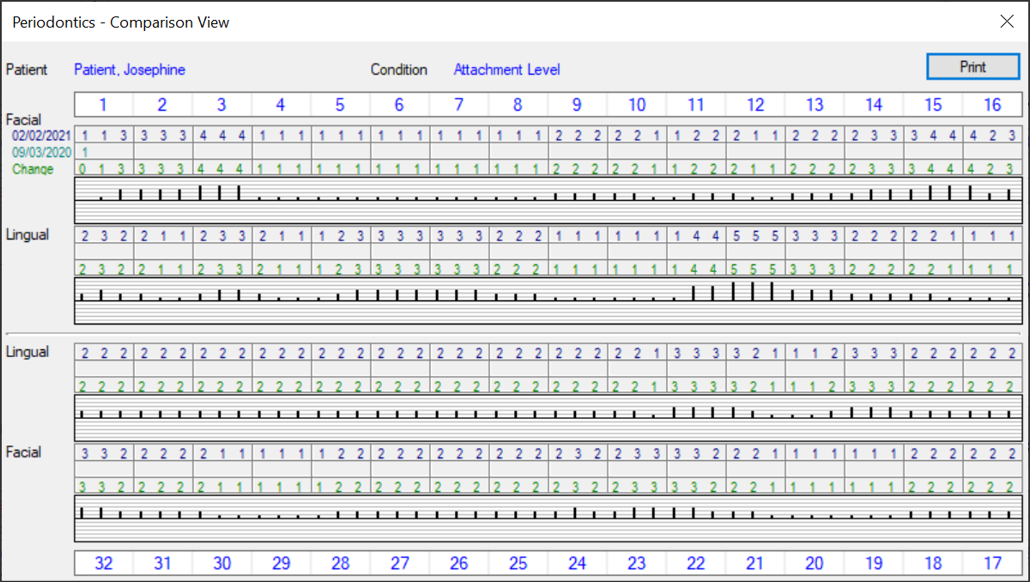
Graphic View:
The patient name and condition being compared display at the top of the window.
For each of the selected exam dates, axiUm displays the value(s) for the condition entered on that date. The amount of change between the two dates is listed under the last exam date and displayed in a bar graph below that.
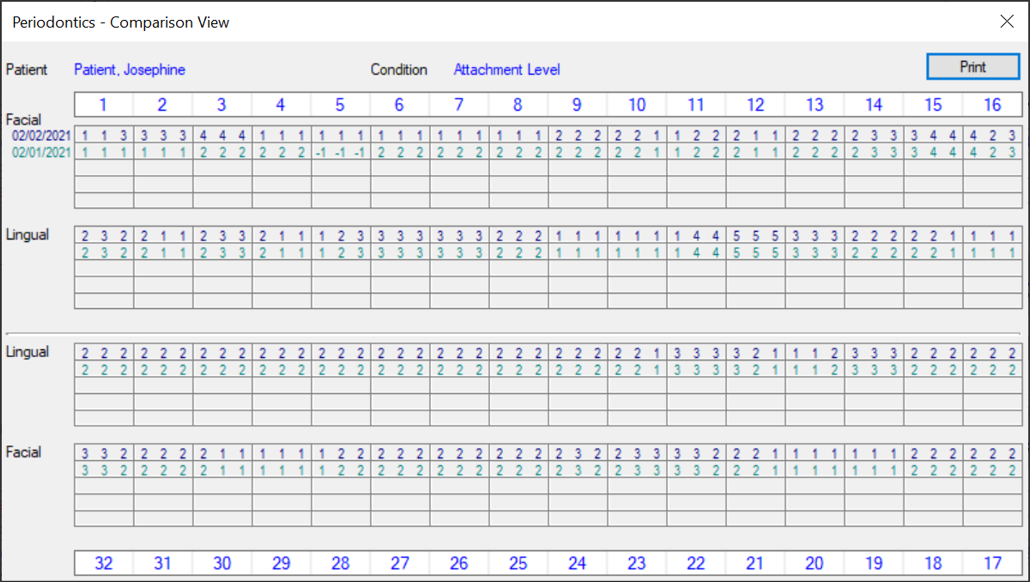
Text View:
The patient name and condition being compared display at the top of the window.
For each of the selected exam dates, axiUm displays the value(s) for the condition entered on that date.
-
(Optional) Click Print to print the comparison data.
|